This critically acclaimed freight forecasting model was first constructed in the 1980s and was later enhanced in the late 90s. This model was developed by estimating the movement of (virtually) all items with weight in the economy, measuring several critical movements of freight transportation in the United States.
 |
Unlike most other sources our data isn’t a survey of activity from a particular portion of the marketplace. Our data covers the entire U.S. domestic freight transportation system. Whether it moves by water, rail, air, pipeline, or truck, our Freight•cast model is able to measure the economy’s impact on transportation demand. This enables us to do a unique piece of work: forecasting transportation demand by commodity by mode by equipment type.
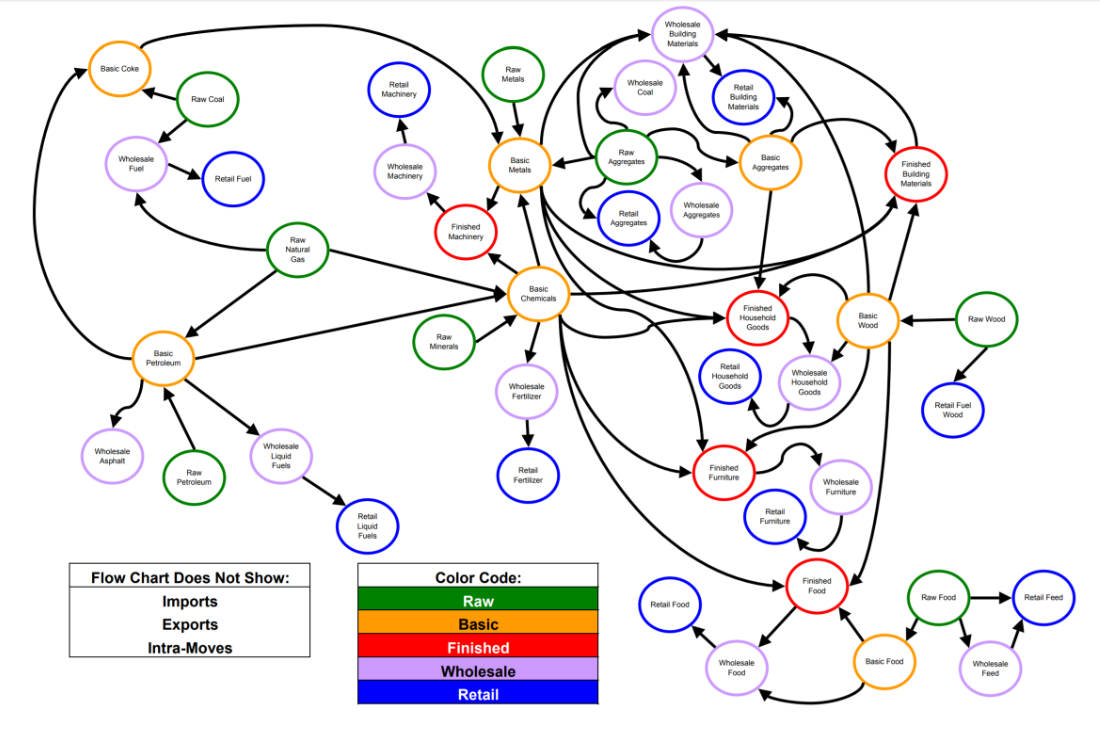
On an annual basis we collect publicly available production data (mined, logged, raised, produced, etc.) from nearly every sector of the U.S. economy (much of it government sourced) and convert it into a tonnage amount. Our extensive research into transportation flows allows us to turn that raw data into an estimate of transportation demand for the whole market. We then split that data into specific commodities, modes, lengths-of-haul, ton-miles, loadings, equipment types, etc.
Each month the Freight•cast forecasts 85,000 series and over 13 million data points. These forecasts track changes in the economy, providing the evidence necessary for identifying market trends, helping companies make sense of the current situation, and plan for the future.
Want to dive into all the details? Click here to view a PDF with a granular look at the components of the Freight•cast model.